To measure inspection latency, define the events you care about, timestamp them consistently, and track each inspection from image capture through processing, result persistence, and operator feedback. Don’t rely on model inference time alone: it may not show whether a result was saved or returned before the production process needed a decision.
An inspection can be fast at one stage and still miss the line’s decision deadline because of image transfer, queueing, retries, or communication with another system. Start by defining the physical deadline—such as when a part reaches a reject gate—and measure the software pipeline against it. The OPC Foundation’s guidance explains why clocks on communicating systems need reasonable synchronization, while Microsoft recommends measuring latency at system boundaries and using percentiles rather than relying on averages. (OPC Foundation; Microsoft Azure Well-Architected Framework).
Before you start: define what “done” means
Before collecting timings, agree on which event starts the clock and which endpoint matters to the decision. A model can finish inference before the result is durably recorded, and a recorded result does not prove that a PLC, reject mechanism, or operator acted on it.
- Decision deadline: Identify the latest time a usable result can reach the control point or the person responsible for the next action.
- Start event: Choose a measurable boundary, such as the camera’s image-captured event. If the trigger occurs before capture, record both; trigger-to-capture time is a separate interval.
- Endpoints: Define separate endpoints for inference completion, result persistence, user-visible feedback, and any confirmed physical action.
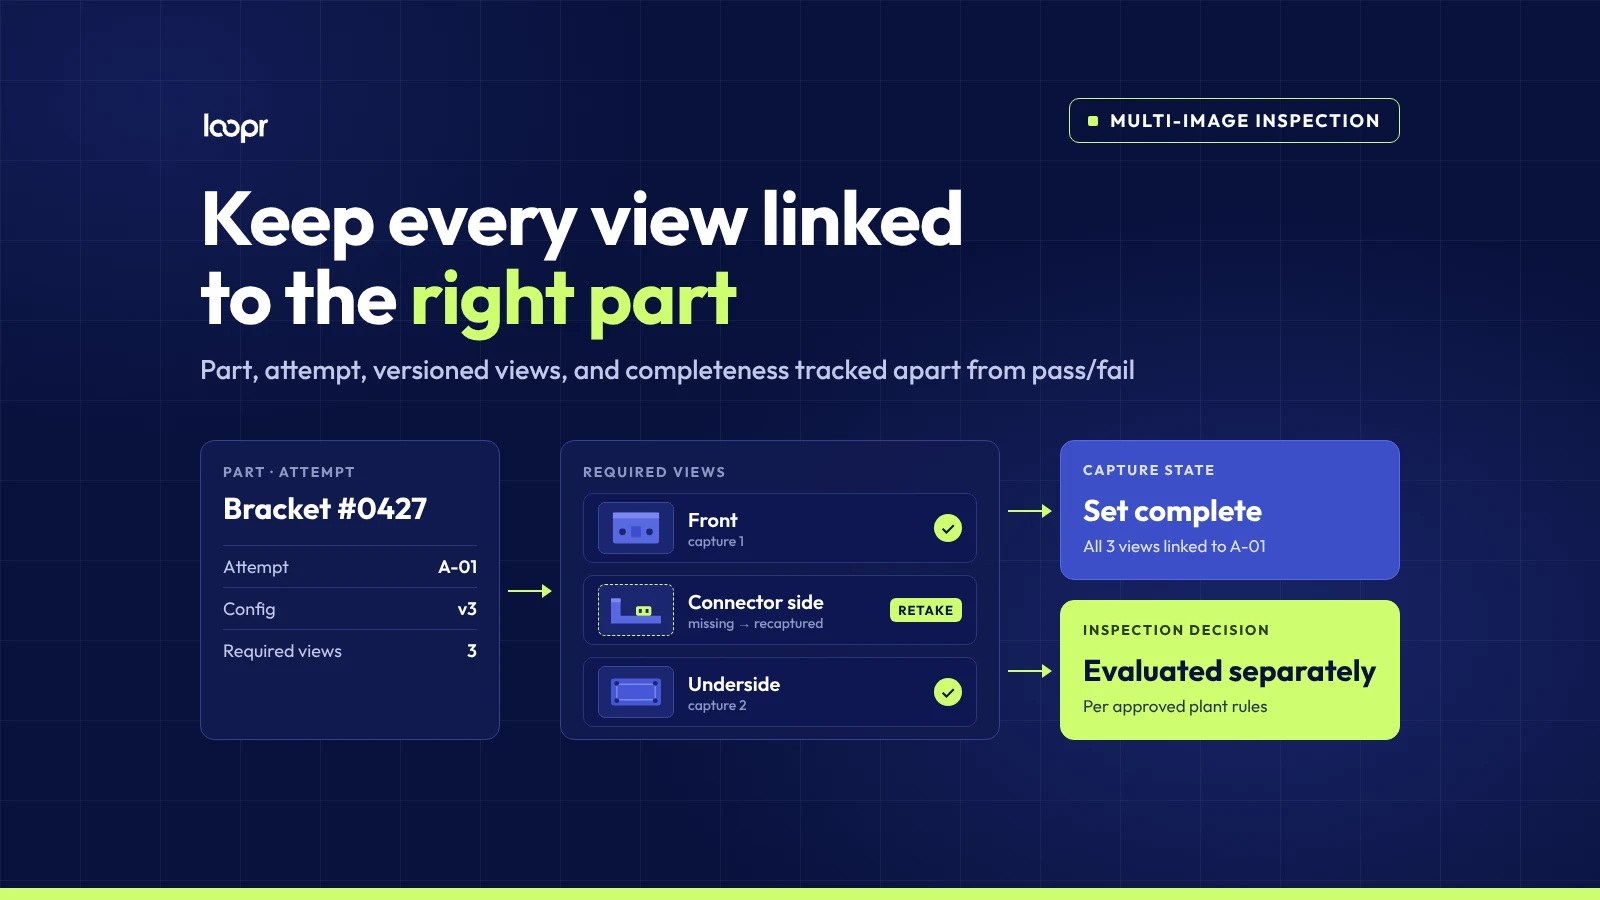
- Inspection identity: Assign a correlation ID to each inspection or part. Include it in timestamps, logs, retries, and result records so stages can be joined without relying on approximate clock time.
- Clock plan: Identify the clock used for each timestamp, how clocks are synchronized, and the known or estimated uncertainty. A timestamp’s displayed precision does not prove its accuracy.
- Test conditions: Record line speed, image size or count, concurrency, and operating state. Set a target based on the process requirement, not an arbitrary speed goal.
If you need to review the acquisition stage, our article on why high-speed defect detection starts with a better image covers lighting, exposure, motion blur, and frame selection. This guide focuses on what happens after capture.
Step 1: Map the path and instrument its boundaries
Draw the path an inspection actually follows. A typical sequence is: capture → image transfer → queue → preprocessing → inference → result handling → persistence → feedback or control handoff. Not every system uses these stages, and some may overlap. Confirm the actual path rather than assuming it is linear.
Add timestamps at the boundaries you need to distinguish. A practical starting set is:
- Image captured.
- Image accepted by the processing service.
- Processing begins, after any queue wait.
- Preprocessing completes.
- Inference begins and ends.
- Result handling begins and ends.
- The result is confirmed persisted.
- Feedback is displayed or delivered to the receiving control system.
- If relevant, the physical action is independently confirmed.
Use a monotonic clock for elapsed time measured within one device or process, where available. Wall-clock timestamps help relate events across systems, but clock offsets and drift can make cross-device subtraction misleading. The OPC Foundation notes that clocks can drift and that time-synchronization errors should be logged. Its OPC UA timestamp guidance also distinguishes timestamps applied by a data source from those applied by a server. (OPC Foundation, time synchronization; OPC Foundation, source and server timestamps).
If two devices have a known maximum clock offset, report that uncertainty alongside any cross-device interval. When you can’t establish a trustworthy bound, don’t present the result as precise. Measure each segment on one clock where possible, or improve synchronization and validate it before using cross-device timestamps for fine-grained comparisons.
Step 2: Separate stage times from end-to-end times
For each inspection, calculate intervals using boundaries on the same clock whenever possible:
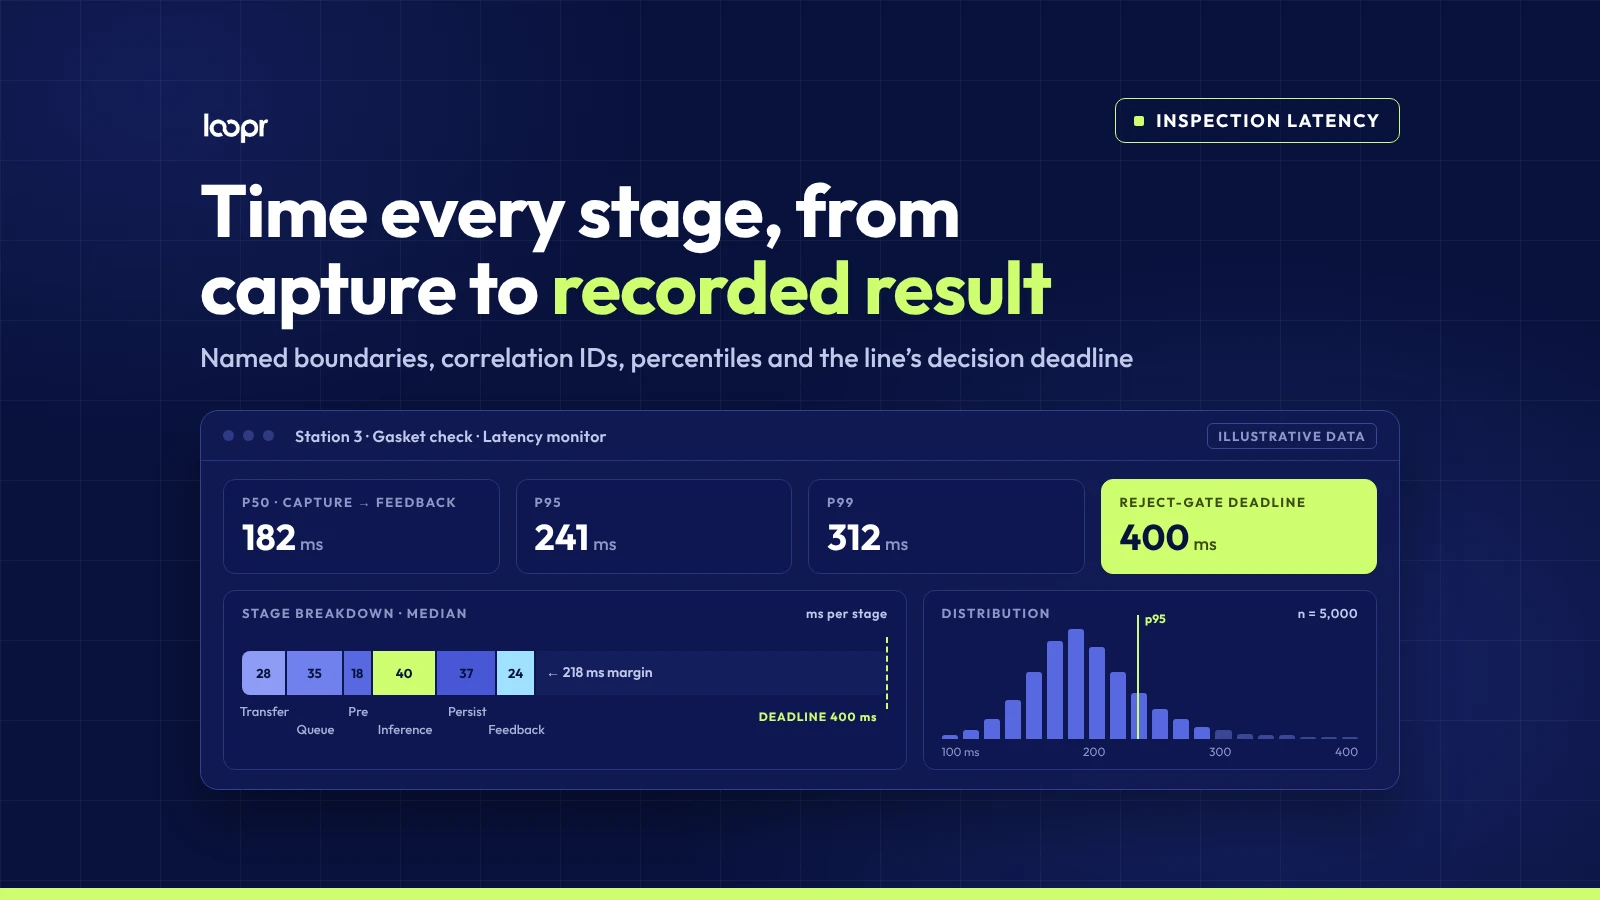
- Transfer time: Capture to receipt by the processing service.
- Queue wait: Receipt to processing start.
- Preprocessing time: Processing start to inference start.
- Inference time: Inference start to inference end.
- Persistence time: Result handling to confirmation that the record was saved.
- Feedback time: From the selected start event to a result visible to the operator or delivered to the next system.
- End-to-end software latency: From image capture to the chosen software endpoint, such as durable persistence or feedback.
- Decision margin: Time remaining between usable feedback and the physical process deadline.
Don’t combine these into one number without naming the boundaries. “Inference took 40 ms” and “the saved result was available 300 ms after capture” describe different intervals; one cannot stand in for the other. Microsoft’s guidance also recommends defining measurement boundaries and breaking latency down by system layer. (Microsoft Azure Well-Architected Framework).
A successful save acknowledgement can establish that a system reported a persistence event, but it cannot, by itself, establish the applicable durability guarantees or prove that a downstream physical action occurred. Confirm what “saved” means with the component that owns the record. If the process requires it, instrument the control or actuation confirmation separately.
Step 3: Track percentiles, throughput, and failures
Collect enough representative observations to see more than a typical fast result. Report the number of inspections, time window, line conditions, and percentiles—commonly p50, p95, and p99—for each important interval. Averages can hide a small number of long delays; Microsoft recommends percentiles to show typical and tail latency. (Microsoft Azure Well-Architected Framework).
Track throughput and failures alongside latency. Include timeouts, dropped images, failed saves, retries, duplicate submissions, and late results. A test that reports only completed inspections can look fast if slow or failed work is excluded.
Test at normal and expected peak concurrency, not only one image at a time. Queueing and shared resources can change results under load. Microsoft’s performance-testing guidance recommends setting measurable acceptance criteria, using production-like conditions, and testing realistic workload behavior. (Microsoft Azure Well-Architected Framework).
Set pass/fail criteria from the actual process deadline. For example, a plant may decide that a defined percentage of inspections must produce feedback before a part reaches a reject station, with a separate maximum acceptable failure rate. That is a requirement to establish for the line, not a universal latency target.
Step 4: Test representative production conditions
Run measurements with representative parts, image sizes, variants, and image counts. Include expected line speed and concurrency, along with normal communication and system conditions. A quiet test with one image and no queue does not establish how the system behaves during a busy shift.
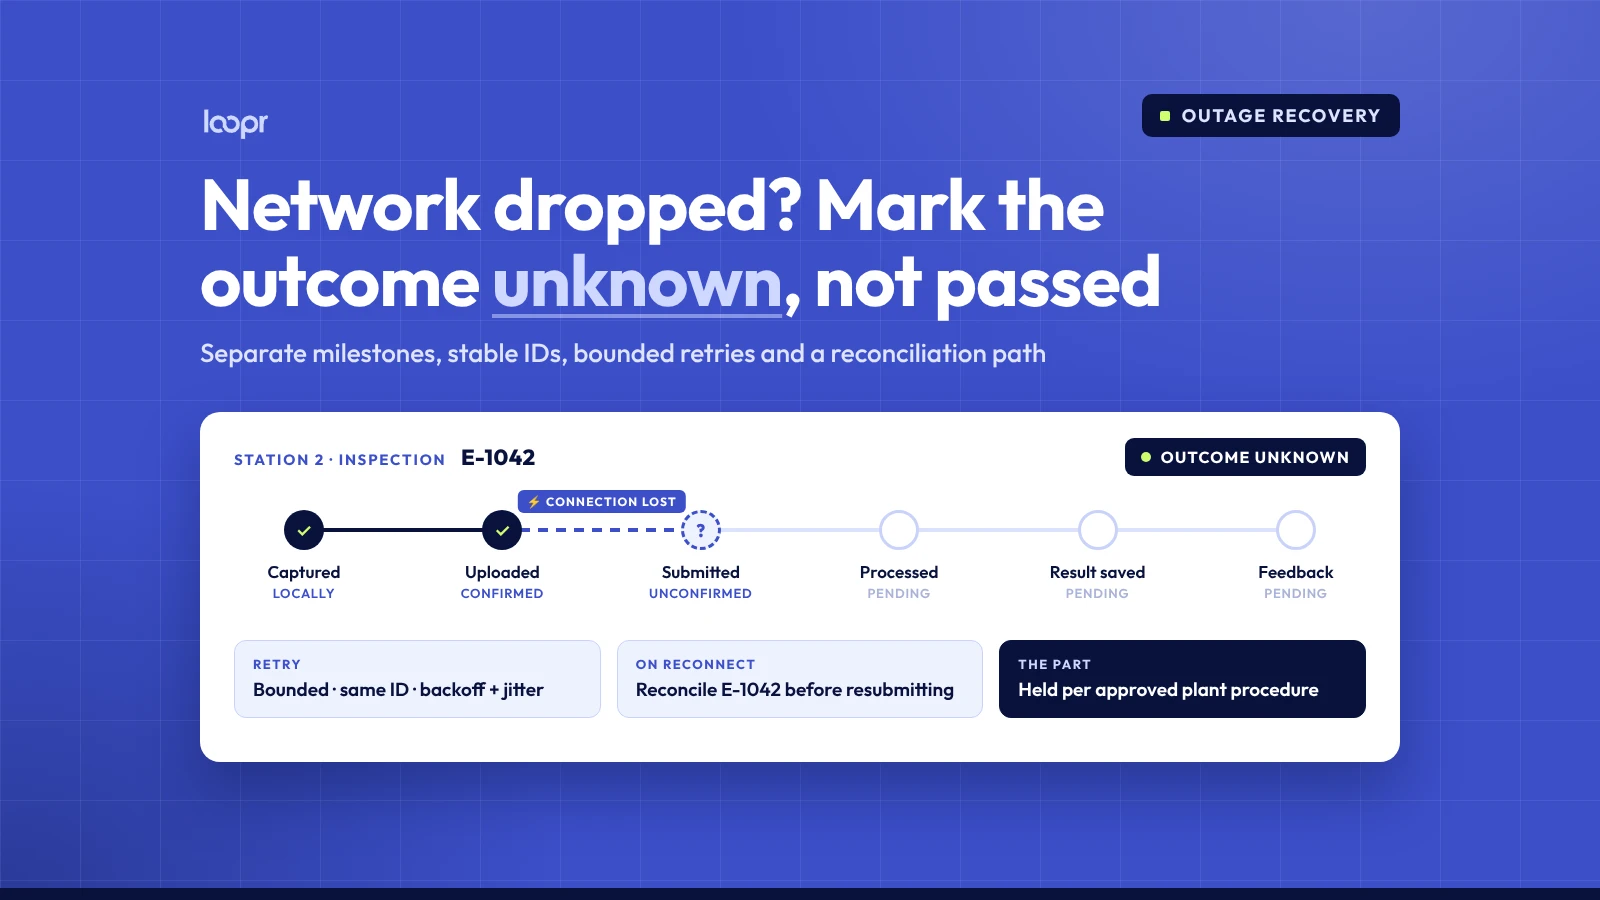
Where safe and approved, test recovery cases too: a temporary service interruption, delayed response, timeout, or retry. Decide in advance how each case should behave. Does the part wait, get diverted, receive a “no result” state, or follow another approved path? A retry may eventually produce a result but still miss the original decision deadline.
Compare measurements across clearly labeled conditions—for example, normal load versus peak concurrency—instead of mixing them into one distribution. Keep the test record with configuration and software changes so later comparisons have context. Production-like testing provides evidence about the tested conditions, but does not guarantee identical performance under every future condition. (Microsoft Azure Well-Architected Framework).
Worked example: gasket check before a reject gate
This example is made up to explain the method. The timing values are hypothetical and are not Loopr performance data.
Suppose a camera captures a housing for a gasket-presence check. The team assigns the image a correlation ID and records capture, service receipt, processing start, inference completion, save acknowledgement, and feedback delivery. It also tracks the part’s arrival at the reject gate using a separately confirmed event.
The interval from capture to inference completion answers how long the model stage took. Capture to save acknowledgement answers a different question, and capture to feedback answers another. If feedback arrives before the part reaches the gate, that shows timing margin for the measured run—but it does not prove the gate moved or that the part was physically diverted. That requires an independent action signal.
Inspection-latency checklist
Answer yes or no for your line:
- Have we defined the physical decision deadline and where it occurs?
- Have we named the start and endpoint for every latency figure we report?
- Can we follow one inspection through its stages using a correlation ID?
- Do we distinguish inference, persistence, feedback, and physical action?
- Do we know the clock source and synchronization uncertainty for each timestamp?
- Do we report percentiles and failures, not just average latency and successful completions?
- Have we tested representative line speed, image volume, and concurrency?
- Do timeout, retry, missing-image, and delayed-result cases have an approved process response?
Limitations: what timing data can and can’t tell you
Latency measurements show how long observed events took under the tested conditions. They don’t establish inspection accuracy, prove an image was adequate, or show that a physical reject or operator action occurred. Assess image quality and inspection performance separately, and instrument physical actions independently when they matter.
Clock uncertainty can make small cross-system intervals unreliable. Logging also adds overhead, and incomplete instrumentation may miss waiting or failure paths. Without correlation IDs, events can be difficult to join confidently; if failed work is omitted, reported latency can look better than the actual process experience.
Finally, a percentile summarizes a measured set, not every future cycle. Retest after changes that may affect the path—such as image volume, concurrency, network conditions, software configuration, or a downstream dependency—and keep the test conditions attached to each result.
Next step: run one end-to-end timing test
This week, select one inspection station and one representative product. Agree on the physical decision deadline, add or identify timestamps for capture, inference completion, confirmed persistence, and feedback, then run a controlled test at the station’s normal production speed. Review the slowest cases and failures with the automation, quality, and plant IT owners before deciding what to optimize.
Evaluating inspection response time on your line? See the Loopr platform or contact the Loopr team about a pilot.
Frequently asked questions
What is inspection latency?
Inspection latency is the elapsed time between defined events in an inspection workflow. State the boundaries—such as capture to inference, capture to saved result, or capture to feedback—because these intervals measure different things.
Is model inference time the same as end-to-end inspection latency?
No. Inference time covers only the model’s processing interval, while end-to-end latency can include transfer, queueing, preprocessing, result handling, persistence, and feedback. Measure both when they answer different engineering questions.
Should inspection latency be measured by average or p95?
Use percentiles such as p50, p95, and p99 alongside sample count and test conditions; an average can conceal long-tail delays. Choose acceptance limits based on the line’s process deadline, not a generic target. (Microsoft Azure Well-Architected Framework).
How do unsynchronized clocks affect latency measurements?
If timestamps come from different clocks, clock offset and drift can distort the calculated interval. Synchronize and monitor clocks, estimate uncertainty, and avoid treating cross-device differences as exact when their uncertainty is unknown. (OPC Foundation).
Does a recorded inspection result prove the part was rejected?
No. A saved result shows a record event according to the system’s persistence behavior; it doesn’t prove that a control system received the decision or that a reject mechanism acted. Measure and confirm those downstream events separately if they are part of the process requirement.
Sources
- OPC UA Part 6: Mappings, Section 6.3, “Time synchronization”, OPC Foundation. Current specification page; publication date not shown.
- OPC UA Part 4: Services, Section 7.11, “DataValue”, OPC Foundation. Current specification page; publication date not shown.
- Architecture strategies for monitoring workload performance, Microsoft Azure Well-Architected Framework. Publication date not shown.
- Architecture strategies for performance testing, Microsoft Azure Well-Architected Framework. Publication date not shown.